
Quick answer
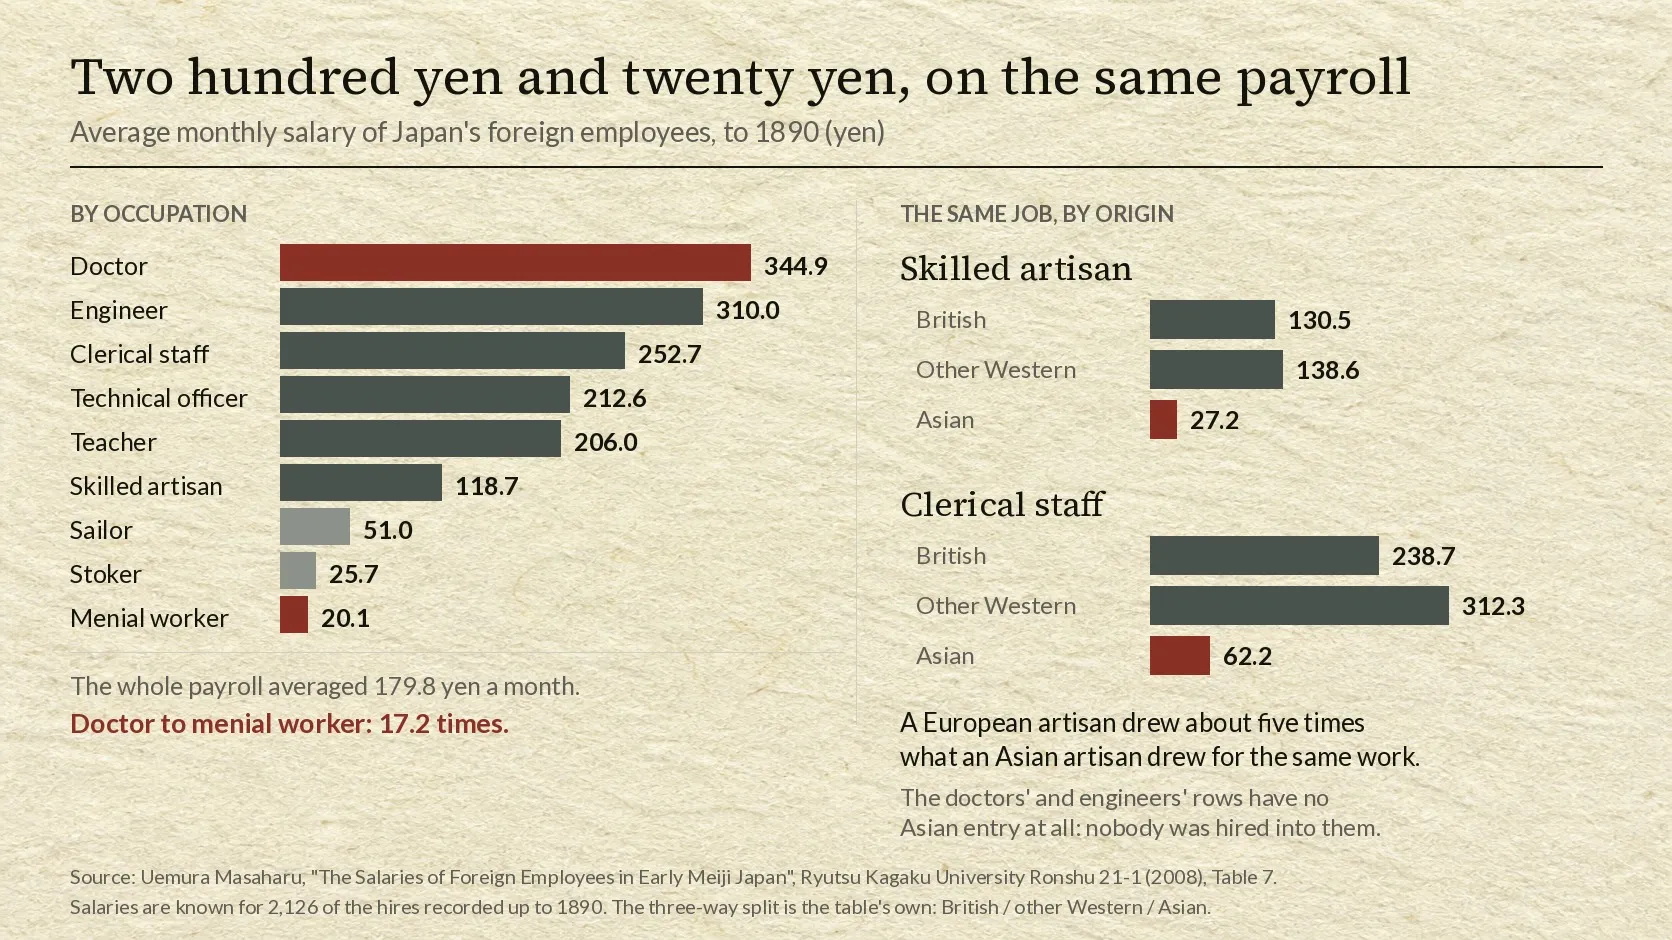
A Japanese government doctor on the foreign payroll drew 344.9 yen a month. A menial worker on the same payroll drew 20.1 yen: one seventeenth as much, from the same ministry, in the same years.
The average across every surviving salary record up to 1890 was 179.8 yen a month. For hires of the central government it was 208.7 yen; for private employers, 123.5.
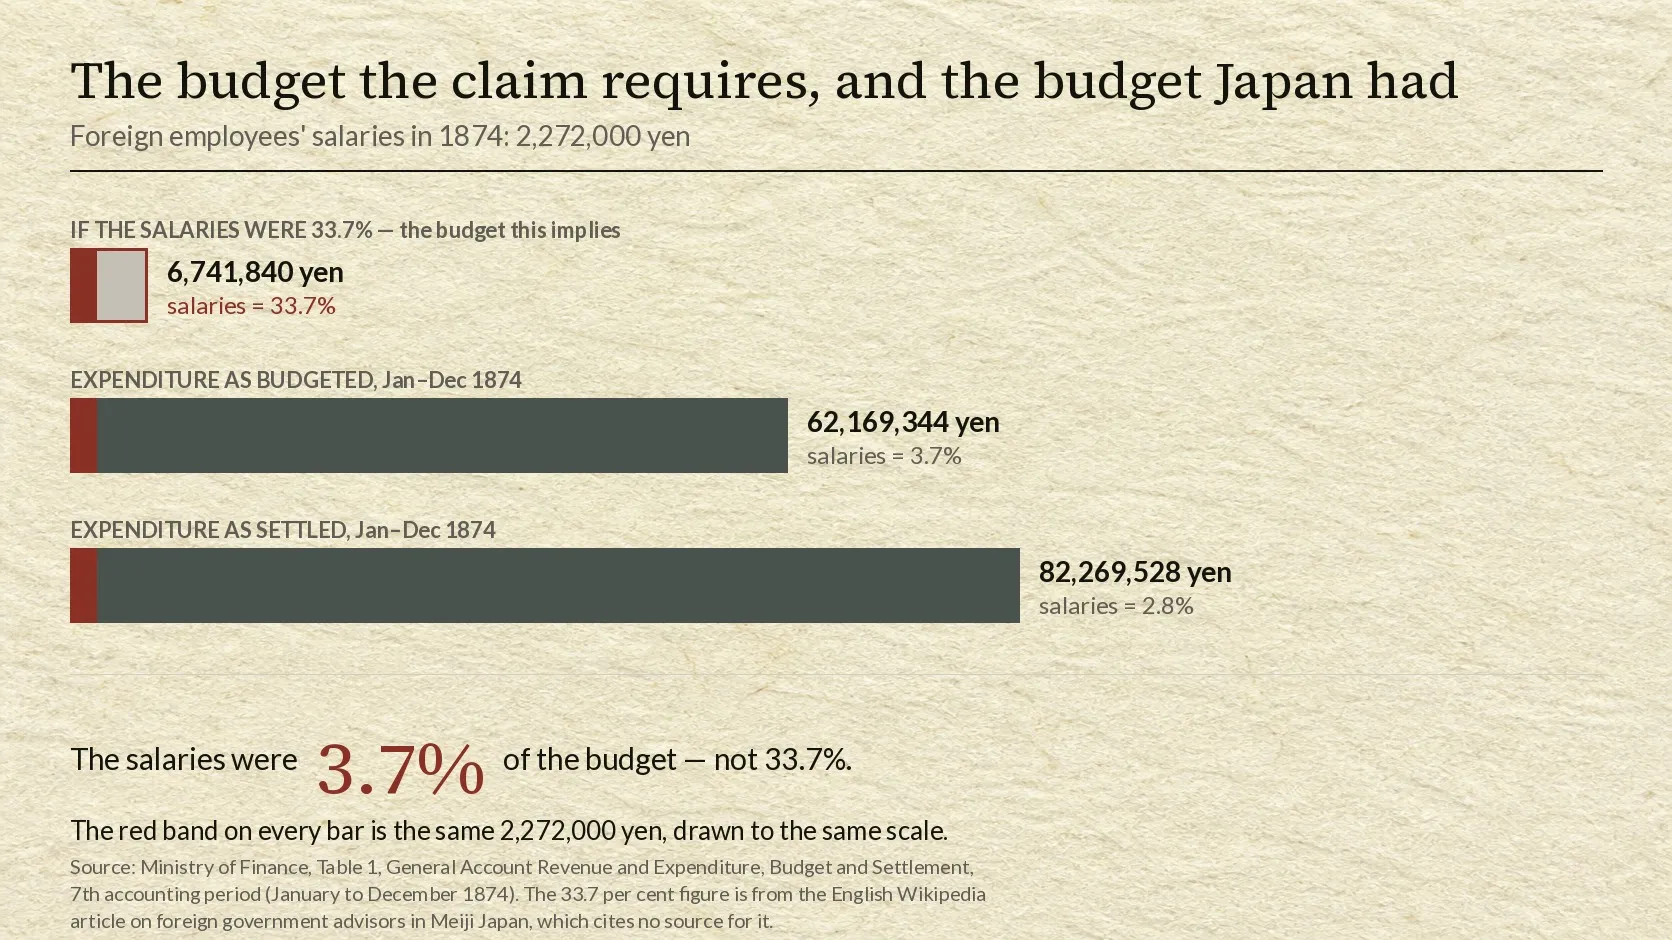
And the number the English-speaking web repeats about all of this (that in 1874 these salaries came to 33.7 per cent of Japan’s national budget) does not survive division. The Ministry of Finance still publishes the budget for that year. It was 62,169,344 yen. The salaries were 3.7 per cent of it.
The sentence that has been copied without being divided
The English-language Wikipedia article on foreign government advisors in Meiji Japan contains one sentence about money:
The O-yatois were highly paid; in 1874, they numbered 520 men, at which time their salaries came to ¥2.272 million, or 33.7 percent of the national annual budget.
No citation is attached to it. It has been reproduced, in that wording or close to it, across the sites that summarise the period for English readers, and it is the answer a search for what Japan paid its foreign advisers returns. It is the same shape as the claim that a hundred thousand people vanish in Japan every year: a figure with a decades-old origin, repeated until it became the answer, and never divided by anything.
Take the two numbers in the sentence and divide one by the other. If 2,272,000 yen was 33.7 per cent of the national budget, the national budget was 6,741,840 yen.
That is the whole of the Japanese state in 1874 (the army, the navy, the Ministry of Public Works, the debt settlement with the former samurai class, the railway to Kobe) for less than seven million yen.
The Ministry of Finance publishes the actual figure, and has done so continuously. Its Table 1, General Account Revenue and Expenditure, Budget and Settlement, from the First Meiji Fiscal Period Onward, runs from the accounting period that began in December 1867. The seventh period covers January to December 1874:
| 1874 (Meiji 7th accounting period) | Yen |
|---|---|
| Revenue, as budgeted | 88,867,636 |
| Revenue, as settled | 73,445,543 |
| Expenditure, as budgeted | 62,169,344 |
| Expenditure, as settled | 82,269,528 |
Against the budget as voted, 2,272,000 yen is 3.7 per cent. Against what the state actually spent, 2.8 per cent. The figure in circulation is roughly nine times the largest defensible answer.
There is a second way to see that the 33.7 per cent cannot stand, and it does not require the Ministry of Finance at all. Uemura Masaharu’s 2008 study of the foreign payroll totals every salary payment traceable in the surviving registers from the end of the Tokugawa period to 1890, and arrives at 19,365,000 yen. If the national budget of 1874 had really been 6.74 million yen, then the salaries of foreign employees alone, over about twenty-five years, would have come to nearly three times the entire annual budget of the state that paid them.
Both checks point the same way. The 1874 payment was a real expense and a visible one. It was not a third of the country.
What the average actually was
Uemura works from two registers of foreign employees, pooled and tabulated by nationality, by employer and by occupation. Salaries are known for 2,126 of the hires up to 1890. The average of those is 179.8 yen a month.
These are monthly figures because the Meiji government paid monthly. It had moved to monthly salaries in 1871, and in 1872 it reset its accounting year to run January to December, a change that removed a thirteenth month of wages from the following year’s books.
The split that matters is not between nationalities but between who was paying:
| Employer | Average monthly salary | Most common salary band |
|---|---|---|
| Central government | 208.7 yen | 101–200 yen (about 32 per cent of hires) |
| Private employers | 123.5 yen | 100 yen or less (51.5 and 63.8 per cent, in the two registers) |
The government’s distribution has a bulge in the 101–200 yen band and a long tail above it that pulls the average up. The private distribution collapses after 100 yen. Whatever the popular image of the foreign expert in Meiji Japan is drawn from, it is drawn from the ministries, not from the country as a whole.
Two hundred yen and twenty yen, on the same payroll
Uemura’s Table 7 breaks the salaries down by occupation. The order runs from doctors to sweepers:
| Occupation | Average monthly salary (yen) |
|---|---|
| Doctor | 344.9 |
| Engineer | 310.0 |
| Clerical staff | 252.7 |
| Technical officer | 212.6 |
| Teacher | 206.0 |
| Skilled artisan | 118.7 |
| Sailor | 51.0 |
| Stoker | 25.7 |
| Menial worker | 20.1 |
Read as a single column, that is a seventeen-fold range inside one category of employee. But the table has a second axis, and it is the one that does the work. Uemura splits each occupation three ways: British, other Western, and Asian.
| Occupation | British | Other Western | Asian |
|---|---|---|---|
| Skilled artisan | 130.5 | 138.6 | 27.2 |
| Clerical staff | 238.7 | 312.3 | 62.2 |
| Menial worker | 12.0 | 46.5 | 16.0 |
A skilled artisan from Europe or North America averaged 130.5 to 138.6 yen. A skilled artisan from Asia (the registers record 250 hires from China and 79 from the Philippines) averaged 27.2 yen, about one fifth. In clerical work the ratio is the same: 62.2 yen against 312.3.
The doctors’ row has no Asian entry at all. Neither does the engineers’. Those columns are empty because nobody was hired into them.
The largest contingent was the cheapest of the five
Britain supplied more foreign employees than anyone else: 1,127 people, 41.9 per cent of the 2,690 hires Uemura counts up to 1890. In person-years the British share rises to 45.8 per cent, because British contracts ran longer than average: 3.41 years against a 3.09-year mean.
But the British were not the best paid.
| Nationality | Hires | Average monthly salary (yen) | Share of total salaries paid |
|---|---|---|---|
| Britain | 1,127 | 182.6 | 43.6% |
| United States | 414 | 206.5 | 17.0% |
| France | 333 | 218.7 | 16.4% |
| Germany | 215 | 244.8 | 12.7% |
| Netherlands | 99 | 246.2 | 5.8% |
| China | 250 | 31.5 | 0.6% |
| Philippines | 79 | 28.4 | 0.1% |
Of the five large Western contingents, Britain’s average is the lowest, and Uemura gives the reason: the British group contained a high proportion of artisans and sailors, the two occupations at the bottom of the Western scale. The Dutch and German groups, by contrast, were weighted towards engineers, doctors and teachers.
The distribution by employer is just as lopsided. Of British hires, 54.8 per cent went to the central government, and the Ministry of Public Works alone took 43.4 per cent of every British hire in the registers. French hires went the other way: 48.8 per cent to the armed forces, and 87.2 per cent of everyone the Army Ministry hired was French.
Those five Western countries together accounted for 95.6 per cent of all salary payments. China and the Philippines supplied 12.2 per cent of the people and received 0.7 per cent of the money.
Six to thirteen times a Tokyo stonemason
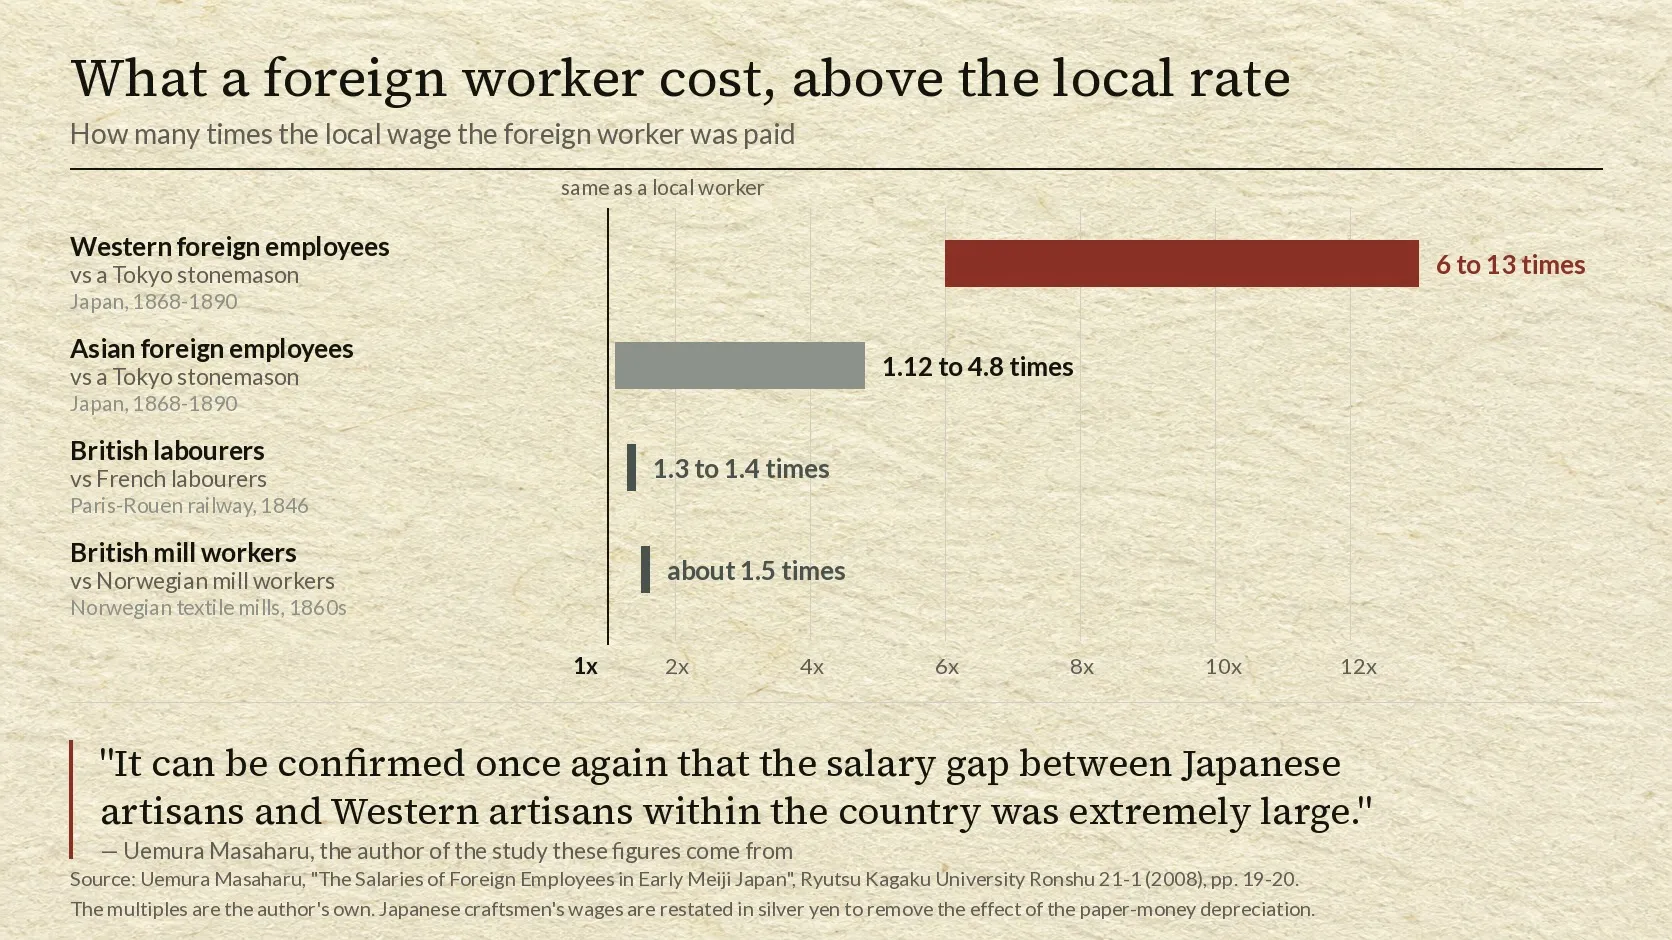
The comparison that gives the figures their scale is one Uemura makes himself, and he makes it against a Japanese benchmark: the monthly earnings of Tokyo craftsmen (carpenters, stonemasons, plasterers and smiths) converted from daily wages and restated in silver yen to remove the effect of the paper-money depreciation.
Against the stonemason, who was among the better paid of the four, he finds that Western foreign employees drew six to thirteen times as much, and that Asian foreign employees drew 1.12 to 4.8 times as much.
The question is whether a gap of that size was normal for the period. Uemura tests it against two European cases:
- Paris–Rouen railway, 1846. French labourers were paid 3.5 francs a day in summer and 3 francs in winter. British labourers on the same works were paid 4.5 and 4.25. The gap is 1.3 to 1.4 times.
- Norwegian textile mills, 1860s. The gap between British and Norwegian mill workers was about 1.5 times.
Then he states the conclusion in his own words:
国内における日本人技能工と欧米人技能工との給与格差がきわめて大きいことが改めて確認できよう。
It can be confirmed once again that the salary gap between Japanese artisans and Western artisans within the country was extremely large.
Britain paid its own emigrant workers a premium of about a half over the locals in Norway. Japan paid a premium of six to thirteen times.
Distance was part of the price
Uemura converts the salaries into pounds sterling to make the comparison directly. In 1866 a Western artisan on the Japanese payroll was earning 19.7 pounds a month, about 1.5 times what the British workers in the Norwegian mills were getting, which he puts at around 13 pounds. From 1872 the figure passes 30 pounds a month, and the multiple reaches 2.3 times.
He then sets one distance against another. London to Oslo is about 1,200 kilometres, two or three days by sea in the 1860s. When Yamanobe Takeo travelled from Yokohama to Southampton in 1877 to study in Britain, the journey took 58 days.
For two centuries that distance had been crossed by paper, one intelligence report a year, carried by a single Dutch ship. The salaries in this article are what it cost to stop reading about the outside world and hire it instead.
By 1881 the Japanese premium had fallen back to 23.8 pounds a month, 1.8 times the Norwegian rate, and the number of hires fell with it. Uemura runs the correlation between the number of foreign employees and their average sterling salary and gets 0.771 on a five-year moving average and 0.608 year by year, both significant at the 1 per cent level.
The salary was not only a price for expertise. It was a price for fifty-eight days.
So how much?
Across the whole period to 1890: 179.8 yen a month on average, 208.7 if the employer was the state, 123.5 if it was a private firm. Some 2,690 people, 9,789 person-years, and 19,365,000 yen in total salary, a figure that is itself conservative, because the registers thin out after 1880 and Uemura says so.
At the top, a doctor at 344.9 yen a month and an engineer at 310.0. At the bottom, on the same registers, a menial worker at 20.1. Between the two, the line that divided the payroll most sharply was not rank but origin: a European artisan at 130.5 yen and an Asian artisan doing the same work at 27.2.
And 3.7 per cent of the national budget, not 33.7.
What we could not confirm
- The 1874 figures themselves. The 2.272 million yen and the 520 men come from the English Wikipedia sentence, which carries no citation, and we could not trace them to a Japanese source. We have tested them rather than adopted them: the arithmetic above shows that whatever their origin, the 33.7 per cent attached to them cannot be a share of the national budget. One further check leaves a question open: 2,272,000 yen shared among 520 people is about 364 yen a month each, which is well above the 208.7 yen average Uemura computes for government hires across the whole period. It is not impossible, since salaries peaked in the mid-1870s, but we could not verify what population the 520 covers.
- Whether the 33.7 per cent belongs to a ministry rather than the state. The Ministry of Public Works employed roughly 40 per cent of all foreign hires, and a third of that ministry’s budget would be a very different and quite plausible claim. We could not test it: the Ministry of Finance’s expenditure table by ministry (Table 6) skips 1874 entirely (its Meiji columns are the 1st period, the 5th period, and then fiscal 1877, 1882, 1887 and 1888) and the Ministry of Public Works, abolished in 1885, has no line of its own in it.
- Where else we looked for the budget. The Statistics Bureau’s Historical Statistics of Japan chapter on public finance is no longer served at its published address; the e-Stat record for the general-account series exists but renders its table through scripting that returns no figures to a direct request, and its API requires a registered key. The National Archives holds the 1874 expenditure records in original form, as scanned images rather than text. The figures used above come instead from the Ministry of Finance’s own workbook, which is machine-readable and which cross-checks against its ministry-level table: both give 57,730 thousand yen for expenditure in the fifth accounting period.
- A precise yen figure for Japanese craftsmen. Uemura presents the Tokyo wage series as a chart rather than a table, so we have quoted his multiples (six to thirteen times, 1.12 to 4.8 times) and not read values off the graph.
- The two counts of British hires. Table 1 gives 1,127 British hires and Table 4-1 gives 1,124. The difference is not an error: Table 4-1 excludes hires whose employer is unknown and splits anyone serving two employers between them, which is why its own total is the fractional 2,677.5 rather than 2,690. Every count in this article is taken from Table 1.
In this article
- Quick answer
- The sentence that has been copied without being divided
- What the average actually was
- Two hundred yen and twenty yen, on the same payroll
- The largest contingent was the cheapest of the five
- Six to thirteen times a Tokyo stonemason
- Distance was part of the price
- So how much?
- What we could not confirm