Quick answer
Japanese police handled 204,562 bodies in 2025, a figure that excludes traffic deaths. They autopsied 20,275 of them. That is 9.9 per cent.
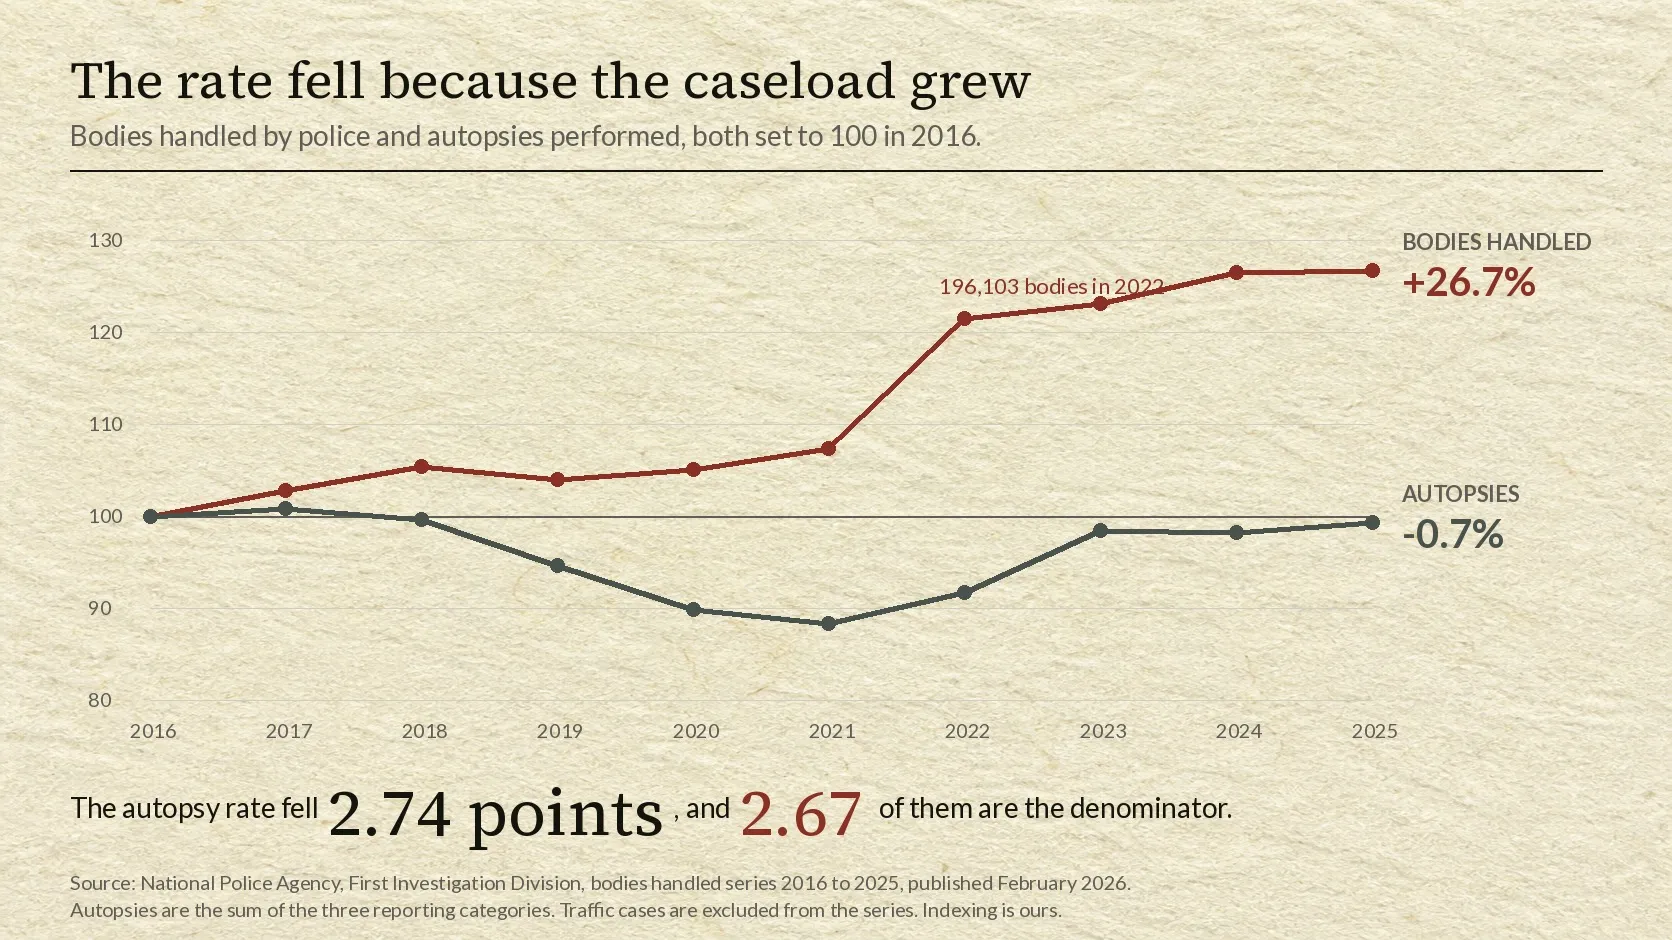
The number is usually presented as evidence of decline, and the rate has indeed come down from 12.7 per cent in 2016. But the fall is not what it looks like. The number of autopsies in 2025 was 20,275. In 2016 it was 20,418. Over nine years the autopsies fell by 143, or 0.7 per cent, while the bodies rose by 43,155, or 26.7 per cent.
Of the 2.74-percentage-point fall in the rate, 2.67 points came from the growth in bodies handled and 0.07 points from the 143 fewer autopsies. Keep the number of autopsies fixed at its 2016 level and apply the 2025 caseload, and the rate would be 9.98 per cent instead of 9.91. In that arithmetic sense, about 97 per cent of the decline is the denominator.
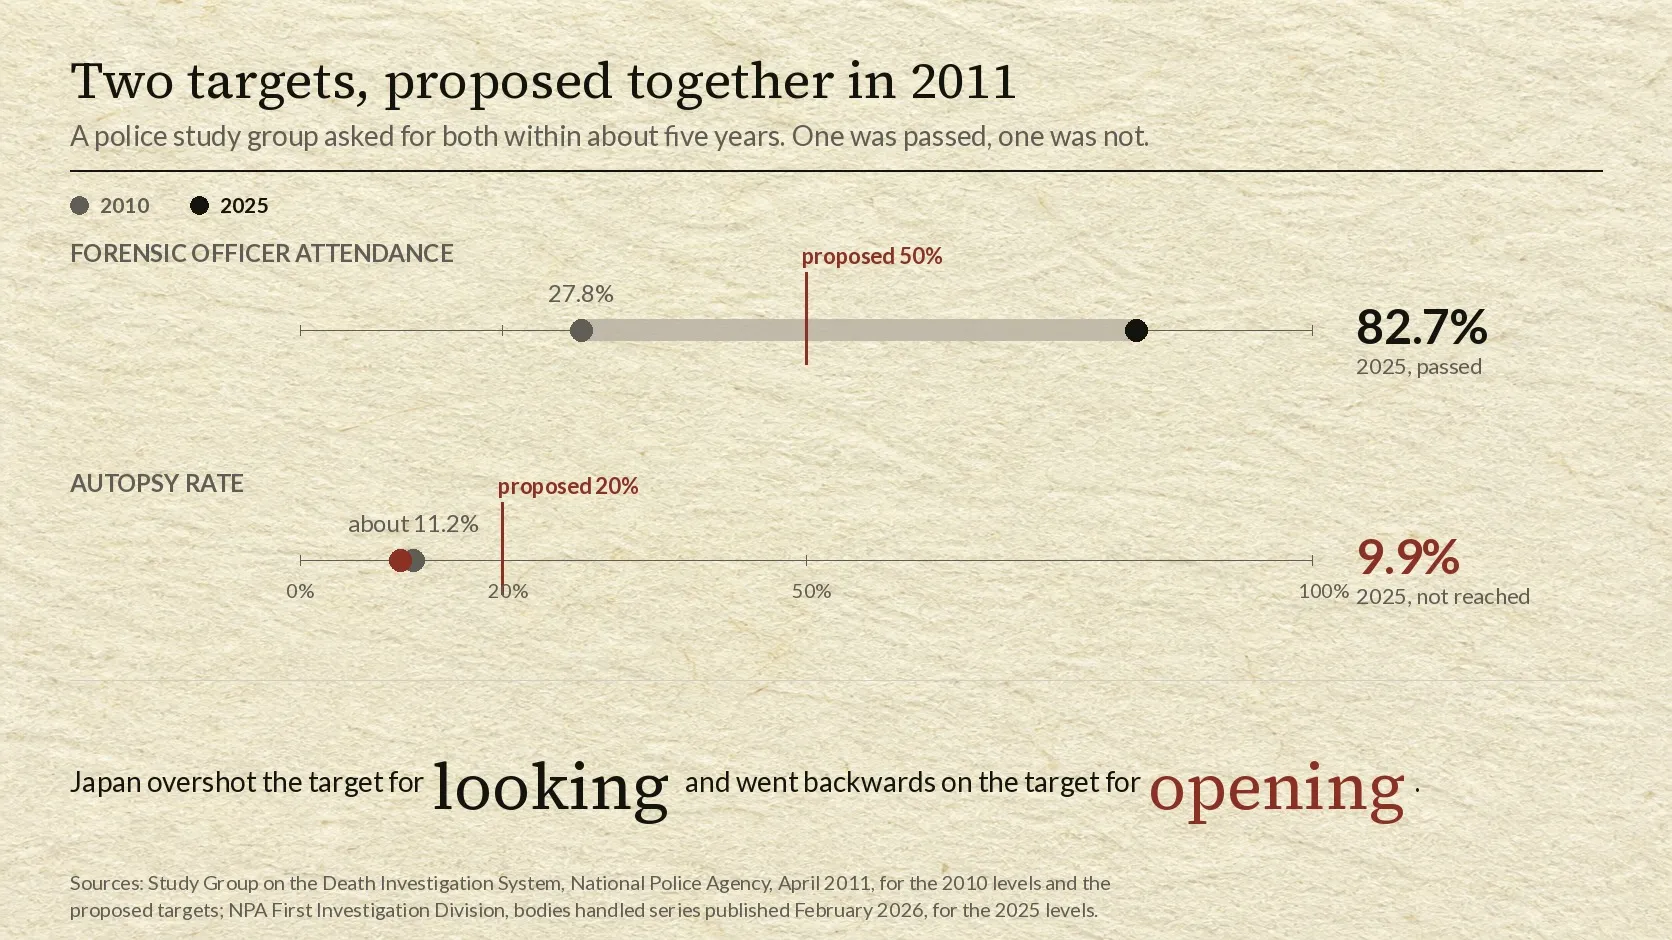
There is a second thing in the tables. In 2011 a study group convened by the National Police Agency proposed two numerical targets for death investigation and asked for both within about five years. One was the autopsy rate, to be raised to 20 per cent. The other was the share of bodies attended in person by a trained forensic officer, to be raised to 50 per cent. Fourteen years later the attendance rate is 82.7 per cent and the autopsy rate is 9.9 per cent. Japan overshot the target for looking and went backwards on the target for opening.
What Japan’s autopsy rate actually measures
The denominator is not deaths in Japan. It is bodies the police handled, and it explicitly excludes traffic cases. The table covers bodies that came into police hands, often following a death that nobody attended or where the cause was not immediately clear.
That same police-handled population is the base for Japan’s first national count of people who died at home while living alone, which is drawn from the same series.
This matters because a second and much smaller figure circulates in English, computed against all deaths in Japan rather than against police-handled bodies. Both kinds of figure can be quoted correctly; they answer different questions. The 9.9 per cent is the one that describes what happens after a body enters the police system, which is usually the question being asked.
The table carries a limitation the police state themselves: it covers what was reported to the First Investigation Division of the Criminal Investigation Bureau. It is an administrative return from 47 forces, not a census of every autopsy performed in Japan.
The number the English-language web still quotes
English-language coverage of this subject settled a decade ago and has not moved. The South China Morning Post ran a feature asking whether Japan’s low autopsy rate was hiding killers, and gave the rate as 11.7 per cent in 2014. The Japan Times ran an editorial in February 2016 under the heading “A troubling low autopsy rate.”
The 11.7 per cent is real. It appears in the National Police Agency’s own series for 2014. But the SCMP describes it as the share of “unusual deaths” that resulted in autopsies, and that label does not match the table. The denominator behind 11.7 per cent is the same one behind 9.9 per cent: bodies handled by police, traffic cases excluded. “Unusual death” is a different concept, drawn from the medical reporting obligation, and it is not what this series counts.
So the figure has been carried into English with the wrong denominator attached, and then left in the present tense for ten years. The pattern is familiar from the claim that a hundred thousand people vanish in Japan every year and from the sentence about foreign advisers taking a third of the national budget: a number once attached to a specific year and a specific base, repeated until the year and the base fell off. The same thing has happened to the share of Japanese citizens said to refuse jury duty, where a rate of applications a court granted is reported as an act of refusal by the public. It has happened again with the number of elderly people in Japanese prisons, where a count of arrivals over a year and a count of everyone inside on one day are quoted as if they answered the same question.
One correction runs the other way, against this article. Because 2014 was 11.7 per cent and 2016 was 12.7 per cent, the rate was rising when those pieces were written. Taking 2016 as the starting point for a decline, as this article does, is taking the peak. From 2014 the fall is 1.8 points, not 2.8.
In 2011 a police study group proposed two targets
In April 2011 a study group convened by the National Police Agency published a report with a long title and a narrow purpose: how to design a death investigation system that would stop criminal deaths being missed. The report says in its opening paragraph that it was written against a background of public attention following the discovery of such cases.
It quantifies them. The agency analysed 43 cases of missed or mishandled criminal deaths that had come to light since 1998, and found that in 22 of them the cause of death had been recorded wrongly, adding that in most of those an autopsy would probably have prevented the error.
It also gives a figure for the other direction, the yield of opening bodies that nobody suspected. In 2009 the Tokyo medical examiner’s office performed autopsies on 2,700 bodies that examination had already classified as involving no crime. One turned out to be a death caused by a crime. The report adds that similar cases had been found at that office in most previous years, a few each year.
On autopsies, the report observed that the 23 wards of Tokyo, where a medical examiner’s office exists and the system is most developed, had an autopsy rate of 20 per cent, and proposed that the national rate be raised to 20 per cent as the immediate target, to be achieved in “about five years.” As a longer-term goal, measured against international practice, it named 50 per cent. The national rate at the time was about 11.2 per cent.
On attendance, it proposed raising the share of bodies attended in person by a kenshikan, a police officer with specialist training in death investigation, from 27.8 per cent to 50 per cent within five years, with 100 per cent as the long-term goal.
The language matters for what follows. These were recommendations, phrased as what the study group proposed and what it asked the relevant ministries to work towards. They were not a statute or a cabinet decision. Japan did legislate in this area, twice: the 2012 Act that created the second category of autopsy, and the 2019 Basic Act that put death investigation on a permanent statutory footing. Neither carries the numbers.
It overshot one and went backwards on the other
| Proposed in 2011 | Level in 2010 | Proposed target | Level in 2025 |
|---|---|---|---|
| Forensic officer attendance | 27.8% | 50% in five years, 100% long term | 82.7% |
| Autopsy rate | about 11.2% | 20% in five years, 50% long term | 9.9% |
The attendance figure was not merely reached, it was passed by a wide margin. The number of trained forensic officers rose from 341 in 2016 to 403 in 2025, and attendance rose from 78.2 per cent to 82.7 per cent over the same period, having already climbed steeply from 27.8 per cent in the years after the report.
The autopsy figure moved the other way. Fourteen years after a proposal of 20 per cent within five years, with 50 per cent named as the destination, the rate is below where it started.
It is possible to read this as a failure of will, and easy to write it that way. The tables support a narrower reading. Attendance is a staffing decision inside the police: train more officers, send them out, and the number moves. Autopsy work sits mostly outside the police, in university forensic medicine departments and a small number of dedicated institutions, and cannot be increased by an internal instruction. The 2011 report said as much: it counted about 170 doctors performing these autopsies nationally and calculated that the 20 per cent target would require substantially more.
What happened in 2022
The decline is not smooth. The rate ran 11.7, 12.4, 12.7, 12.4, 12.0, 11.5, 10.8, 10.4, then dropped to 9.5 per cent in 2022, then went 10.1, 9.8, 9.9.
The step is in the denominator. Bodies handled went from 173,220 in 2021 to 196,103 in 2022, an increase of 13.2 per cent in a single year, the largest movement anywhere in the series. We have not established what produced it. The police tables give the size of the step and not its composition, and we found no statement that the counting definition changed that year.
Since then the series has flattened. The 2025 figure of 204,562 was 378 bodies above 2024, an increase of 0.19 per cent. The low point of the autopsy rate is 2022, and the last three years are a plateau rather than a continued fall.
One word, three reporting categories
English reduces all of this to “autopsy.” The Japanese tables use three reporting categories, which cover several different legal procedures, and the distinction is the key to the rest of the numbers. The National Police Agency publishes a flowchart of the whole sequence.
A body is first classified in one of three ways: as a death clearly caused by a crime, as a death in which a crime is suspected, or as everything else. What follows differs by classification.
- Forensic autopsy (shiho kaibo) requires a warrant from a court and is performed as part of a criminal investigation.
- Investigation Act autopsy (chosaho kaibo) was created by a 2012 statute. A police station chief, after hearing the opinion of a forensic specialist, may order it where he finds it particularly necessary in order to establish the cause of death.
- The residual category is defined by the police only as an autopsy that is neither of the above. The flowchart says what it contains: in areas with a medical examiner system, an autopsy by a medical examiner under article 8 of the 1949 Act on post-mortem examination; everywhere else, an autopsy performed with the consent of the family under article 7 of the same Act.
The total stayed flat because its parts moved against each other
| Category of autopsy | 2016 | 2025 | Change |
|---|---|---|---|
| Forensic autopsy | 8,326 | 9,859 | +18.4% |
| Investigation Act autopsy | 2,605 | 3,886 | +49.2% |
| Residual category | 9,487 | 6,530 | -31.2% |
| Total | 20,418 | 20,275 | -0.7% |
The flat total conceals offsetting shifts. The two procedures the police can initiate themselves both grew, one of them by nearly half. The category that depends on a medical examiner’s office or on asking a bereaved family fell by almost a third.
The classification of bodies, which is a separate table from the classification of autopsies, moved as well. Bodies recorded as clear criminal deaths fell from 598 to 361, down 39.6 per cent. Bodies where a crime was suspected fell from 20,144 to 18,801. The entire increase in the caseload is in the third group: bodies in the residual classification rose from 140,665 to 185,400, up 31.8 per cent.
One caution belongs here. A fall in one autopsy category and a rise in another can be a real change in practice, or the same autopsies recorded under a different legal basis after the 2012 Act took effect. The published tables give counts by category and do not link them, so we cannot separate substitution from reclassification, and we have not added the increases and the decrease together as though they were independent.
The list of cities has not changed since 1985
The residual category is where the geography sits, and the geography is written into a one-sentence ordinance from 1949.
Article 8 of the Act on post-mortem examination lets a governor place a medical examiner in areas designated by cabinet ordinance. The ordinance that does the designating, last amended in 1985, names five: the wards of Tokyo, Osaka City, Yokohama City, Nagoya City and Kobe City. The 2011 report notes in a footnote that Kyoto City and Fukuoka City had medical examiners when the system began in 1947 and had already abolished them.
The National Police Agency’s own flowchart, in the version published in 2024, names four. Yokohama is not on it.
Set that against the counts. In 2025, of the 6,530 autopsies in the residual category, 6,443 were in four prefectural forces: the Tokyo Metropolitan Police with 3,175, Kanagawa with 1,784, Hyogo with 1,177 and Osaka with 307. That is 98.7 per cent. Kyoto recorded 21 and Okinawa 18. Thirty-three of the 47 forces recorded none at all.
Two of those numbers do not fit the lists.
Aichi, which contains Nagoya City and which appears on the ordinance and on the police flowchart, recorded none, with an overall autopsy rate of 4.7 per cent. Kanagawa, whose only listed city the police flowchart leaves off, recorded the second-largest count in the country. Whatever those 1,784 autopsies are, the flowchart’s own logic puts them under the other article, the one that requires the family’s consent.
The 2011 report also made this comparison, and the other half of it has moved.
| 2010, per the 2011 report | 2025 | |
|---|---|---|
| The four forces: autopsy rate | 23.2% | 16.1% |
| The other 43: autopsy rate | 5.8% | 7.0% |
| Gap | 4.0-fold | 2.3-fold |
| The four forces’ share of all autopsies | 64.9% | 52.3% |
The gap narrowed. But it narrowed mainly because the top came down seven points, not because the bottom went up one. The four forces still handle 32.3 per cent of the bodies and perform 52.3 per cent of the autopsies.
The 2011 report gave a comparable concentration figure for 2010, recording that 94.5 per cent of administrative autopsies were in the same four prefectures. It is not the same measure as the 98.7 per cent above, because the 2011 category predates the 2012 Act that carved out the second procedure, so the two should be read as separate snapshots rather than as a trend.
The two rates do not move together in any clear way
The two figures the 2011 report tried to move are not related to each other across the country.
Across the 47 forces, the correlation between the attendance rate and the autopsy rate is -0.196 by Pearson’s measure and +0.054 by Spearman’s rank measure. The two coefficients show no clear linear or monotonic association in this single year, and the sign is not even stable between them. Split the forces at the median on both measures and they distribute almost evenly across the four combinations: 12, 12, 12 and 11.
The extremes are worth naming as illustrations rather than as a rule.
| Bodies handled | Attendance | Autopsies | Autopsy rate | |
|---|---|---|---|---|
| Hiroshima | 3,668 | 95.4% | 91 | 2.5% |
| Kanagawa | 15,009 | 55.6% | 3,456 | 23.0% |
| Tottori | 1,093 | 100.0% | 75 | 6.9% |
Hiroshima sends a trained officer to almost every body and autopsies one in forty. Kanagawa sends one to just over half and autopsies nearly one in four. Tottori attends every single body in the return and autopsies about one in fifteen.
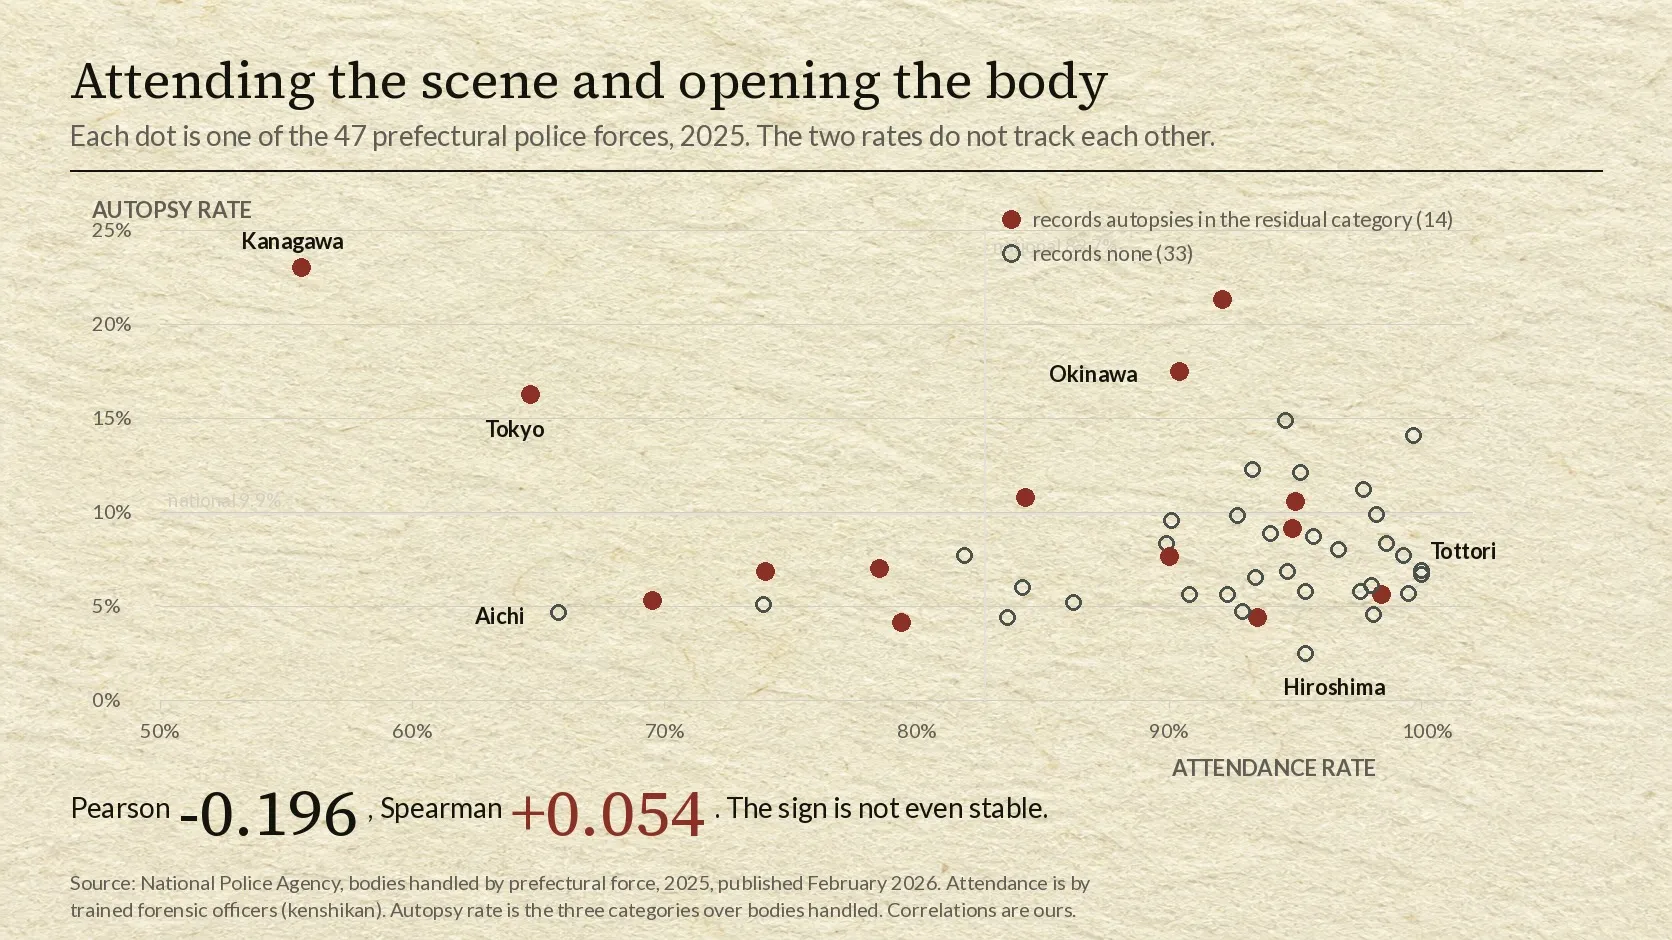
Three prefectures are high on both. Hyogo attends 92.1 per cent of 8,941 bodies and autopsies 21.3 per cent; Okinawa 90.4 per cent of 2,183 and 17.5 per cent; Yamagata 94.6 per cent of 1,751 and 14.8 per cent. Any account built only on Hiroshima and Kanagawa would be selecting two points out of 47.
The national rate also describes fewer places than it appears to. The median prefectural autopsy rate is 7.0 per cent, against a national figure of 9.9. The national number is weighted by the forces that autopsy most, which are the ones with an institution to send bodies to.
Strip the residual category out entirely and the geography does not resolve. The national rate on the remaining two procedures is 6.7 per cent, the median is 6.9, and the spread runs from Okinawa at 16.6 per cent down to Hiroshima at 2.5, a 6.7-fold gap with a prefecture that has no listed medical examiner city at the top. Whatever else produces the spread, it is not only the presence of a designated institution.
What a falling rate does and does not prove
The framing in English has been that a low rate means missed killings. The published tables do not settle that, and they contain material for the opposite reading.
Autopsies performed under criminal-investigation procedure, with a court warrant, rose 18.4 per cent over the nine years. Investigation Act autopsies rose 49.2 per cent. Bodies classified as clear criminal deaths fell 39.6 per cent. The whole of the caseload growth is in the classification where a crime is not suspected. Those figures are consistent with more autopsies being carried out under criminal procedure while the overall rate falls because the pool has been diluted. They do not show whether a larger share of crime-suspected cases was autopsied, because the tables do not report that share.
The competing reading uses the same numbers. The number of autopsies performed has stayed between roughly 18,000 and 20,600 every year for a decade while the caseload grew by a quarter. A roughly flat number spread across a larger caseload implies greater selectivity. The tables do not show whether or how the threshold for opening a body changed, and they do not identify any case that would have been autopsied in 2016 and was not autopsied later.
The 2011 report’s own pair of figures sits between the two readings, and both halves belong together. Of 43 cases where a criminal death had been missed, 22 involved a wrongly recorded cause of death that an autopsy would probably have caught. And of 2,700 bodies opened in Tokyo where examination had found no suspicion of crime, one was a crime, with a few such cases found at that office in most years. The first is why a state would want to autopsy more. The second is what that particular Tokyo cohort returned in that particular year.
What the tables do establish is narrower than either story. The rate fell, and in arithmetic terms almost all of the fall is the denominator. The legal composition of Japanese autopsies changed substantially. One category is concentrated in four forces and 33 forces record none of it. The attendance figure from 2011 was overshot and the autopsy figure was not reached. Whether any of that amounts to a death investigation system that misses crimes is a question these numbers frame rather than answer.
Where else we looked, and what we could not verify
- Which calculations are ours. The 97 per cent decomposition, the prefectural median, the two correlations, the four-force groupings and the rates excluding the residual category are our own calculations from the published National Police Agency tables. They are not figures the agency publishes. We used the counts as printed; displayed percentages may not reproduce exactly because of rounding. Our recomputed national autopsy rate of 9.9 per cent matches the agency’s own published rate, which is the check we have on the arithmetic.
- Why Yokohama is on the ordinance and not on the flowchart. The ordinance in force names Yokohama City. The 2024 police flowchart names four cities and omits it. We did not find a document stating when or how the Kanagawa arrangement changed, so we have reported the discrepancy between the two government documents and not explained it. It follows that we also cannot say how many of Kanagawa’s 1,784 residual-category autopsies were performed under which article of the 1949 Act.
- The 2022 step. Bodies handled rose 13.2 per cent in a single year. We could not obtain a published decomposition of that increase, and we have not obtained a confirmed figure for Japan’s total deaths in 2022 from a primary source, so we have not attributed the step to any cause.
- The composition of the residual category. The flowchart gives the two legal bases and the four cities. It does not break the 6,530 down between medical examiner autopsies and consent autopsies, at national or prefectural level.
- How a body is attributed to a prefecture. The table is organised by police force, which is why Tokyo appears as the Metropolitan Police. We have taken it to count the force that handled the body. We could not find a published rule stating whether an autopsy performed at an institution in a neighbouring prefecture is counted by the handling force or the performing institution, which matters for any comparison between forces.
- Forensic capacity by prefecture. The obvious hypothesis for the spread is the presence of a forensic medicine department with capacity to take cases. The 2011 report counted about 170 doctors nationally. We could not find a current official count broken down by prefecture, and joining private compilations to this series would be our own analysis rather than a reported finding.
- The smaller English figure. A much lower percentage, computed against all deaths rather than police-handled bodies, circulates in English-language writing on this subject. We could not establish its origin or the year and counts behind it, so we have described the difference in denominators without quoting the number.
- The Japan Times editorial. We have cited it by title and date. The page was not retrievable to us at the time of writing, so no figure in this article rests on it.
- Single-year variation. Several of the smallest forces handle fewer than two thousand bodies, so their rates move on small absolute changes. We have given counts alongside rates in the tables above for that reason, and have not built any claim on a single prefecture’s single year.
In this article
- Quick answer
- What Japan’s autopsy rate actually measures
- The number the English-language web still quotes
- In 2011 a police study group proposed two targets
- It overshot one and went backwards on the other
- What happened in 2022
- One word, three reporting categories
- The total stayed flat because its parts moved against each other
- The list of cities has not changed since 1985
- The two rates do not move together in any clear way
- What a falling rate does and does not prove
- Where else we looked, and what we could not verify