Quick answer
No. The figure is real, it is published by the Supreme Court of Japan, and for 2025 it is 67.6 per cent. But it does not measure refusals. It counts applications to be excused that the court granted, and the largest block of grounds, 41.5 per cent of them, is a bundle of statutory categories the Act itself lists: being seventy or over, being a student, having served as a lay judge within the past five years. A candidate in one of those categories does not have to give a reason beyond the category. The court publishes the bundle as a single total and does not break it down, so how much of it is age alone is not on the record.
There is also a second number in the same report, 67.1 per cent, which measures something entirely different. It is the attendance rate. The two figures are one half of a percentage point apart and are routinely swapped.
Where the number comes from
Every year since 2009 the General Secretariat of the Supreme Court has published a report on how the lay judge system actually ran. It is required by Article 103 of the Act that created the system. The 2025 edition is the seventeenth, it covers 1 January to 31 December 2025, and it is 106 pages of tables.
The relevant one is Figure 26. It gives a single national number:
Proportion of saiban-in candidates for whom a decline was granted (total): 67.6
The report defines that phrase in its own glossary. It is the sum of three groups: candidates who, having applied, were not summoned at all; candidates whose summons was cancelled after it had been issued; and candidates whose application was granted on the day of the selection hearing. All three are applications by a candidate that a court then granted. The statistic does not directly measure unilateral refusals, and it does not measure failures to appear.
The underlying counts for 2025:
| Candidates | |
|---|---|
| Selected as candidates across all cases | 97,958 |
| Declines granted (all three stages) | 66,254 |
| — not summoned | 29,614 |
| — summons cancelled | 34,136 |
| — granted on the day | 2,504 |
66,254 divided by 97,958 is 67.6 per cent. That is the whole of the arithmetic.
Note what the denominator is. It is not the population, and it is not people who received a letter. It is the count of candidate slots the courts drew for the year’s cases, 801 verdicts in total, which works out at 122.3 candidates selected for every verdict eventually delivered.
What the whole funnel produces
The declines figure is one narrowing in a sequence of them, and the sequence is published in the same summary table. Reading it requires one piece of care, which the report supplies: the candidate counts are per case. A person drawn for two cases is counted twice. The report labels them as such.
Because of that, the cleanest way to read the sequence is per verdict, which is how the report itself presents the averages. There were 801 verdicts in 2025. Against those 801 trials, the year produced 4,691 appointed lay judges and 1,590 supplementary lay judges, which is 5.9 and 2.0 per verdict, and those two counts are real people.
801 verdicts is the whole of the lay judge system for a year. It sits inside a criminal justice system in which most punishment is imposed with no hearing and no courtroom at all: in 2023, 162,761 people were sentenced by a summary court judge who never saw them. Citizens are asked to judge the gravest charges, and only those.
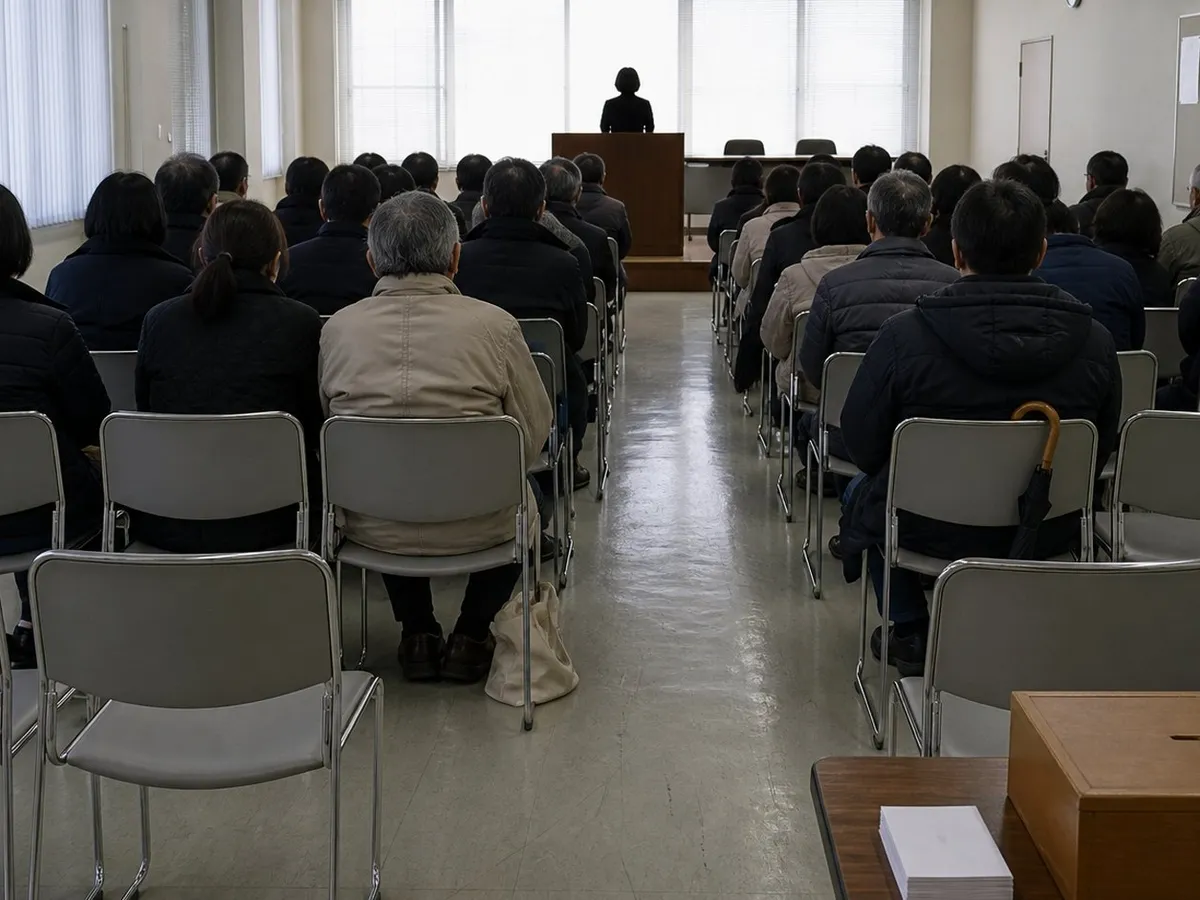
So the shape of a single lay judge trial in 2025 was this. The court drew about 122 candidate slots, wrote to about 84, cancelled about 44 of those letters, seated a room of about 27 people, and swore in about 8 of them. The full table is below.
The decline is therefore not the last narrowing, or even the sharpest one at the courthouse door. A selection hearing calls far more candidates than there are seats to fill, so most of the people who attend are not chosen. That is a matter of arithmetic rather than reluctance: the panel’s lay judge seats and its supplementary seats are filled from the room, and the rest of the room goes home.
The largest block of grounds is a list the Act wrote
The report breaks the 66,254 down by the ground on which the decline was granted. Article 16 of the Act lists them. Items one to seven are categories of person; item eight is a general “unavoidable circumstances” clause with named examples.
| Ground | Candidates | Share |
|---|---|---|
| Article 16, items 1–7 (age 70 or over, students, recent former lay judges, sitting local assembly members, recent prosecution review board members) | 27,519 | 41.5% |
| Important business duty (item 8(c)) | 18,511 | 27.9% |
| Serious illness or injury (item 8(a)) | 7,005 | 10.6% |
| Care of a co-resident relative (item 8(b)) | 4,391 | 6.6% |
| Other mental or economic disadvantage (Cabinet Order item 6) | 4,745 | 7.2% |
| Living far from the court (Cabinet Order item 5) | 1,301 | 2.0% |
| Care of a relative, other than 8(b) (Cabinet Order item 2) | 1,031 | 1.6% |
| Funeral of a parent, other important social duty (item 8(d)) | 848 | 1.3% |
| Attending a relative in hospital (Cabinet Order item 3) | 470 | 0.7% |
| Pregnancy or within eight weeks of birth (Cabinet Order item 1) | 379 | 0.6% |
| Attending a birth (Cabinet Order item 4) | 51 | 0.1% |
| Rebuilding a life after a major disaster (item 8(e)) | 3 | 0.0% |
The twelve rows sum to the 66,254 total. Two of them account for 69.4 per cent of every decline granted in 2025: the statutory categories at 41.5 per cent, and work at 27.9 per cent.
The statutory categories deserve reading slowly, because they are the largest block and they are the least like a refusal. Article 16 says a person “may apply to be excused” if they are, among other things:
- aged seventy or over;
- a student or pupil enrolled in a course requiring regular attendance;
- a member of a local assembly, while it is in session;
- someone who served as a lay judge or supplementary lay judge within the past five years;
- someone who served on a prosecution review board within the past five years.
None of these require a view about the justice system. A candidate who is seventy-one is in the category on the day the letter arrives. The Diet wrote the category in 2004 precisely so that such a person would not have to argue.
The court publishes these seven items as one figure, 27,519, and does not say how many fell under each. Age seventy is the first item on the list and the only one that applies to a large and growing share of the electorate, but the report does not let anyone put a number on it. What can be said is that the largest block of grounds is the one where no reason is required.
There is a second 67, and it is a different thing
Figure 24 is the table that follows candidates from selection to the door of the courtroom. It also contains the number most often confused with the one in the title. For 2025:
| Stage | Candidates | Per verdict |
|---|---|---|
| Selected as candidates | 97,958 | 122.3 |
| Measures taken not to summon | 30,423 | 38.0 |
| Summonses sent | 67,535 | 84.3 |
| Summonses cancelled | 35,342 | 44.1 |
| Attended the selection hearing | 21,598 | 27.0 |
| Attendance rate | 67.1% |
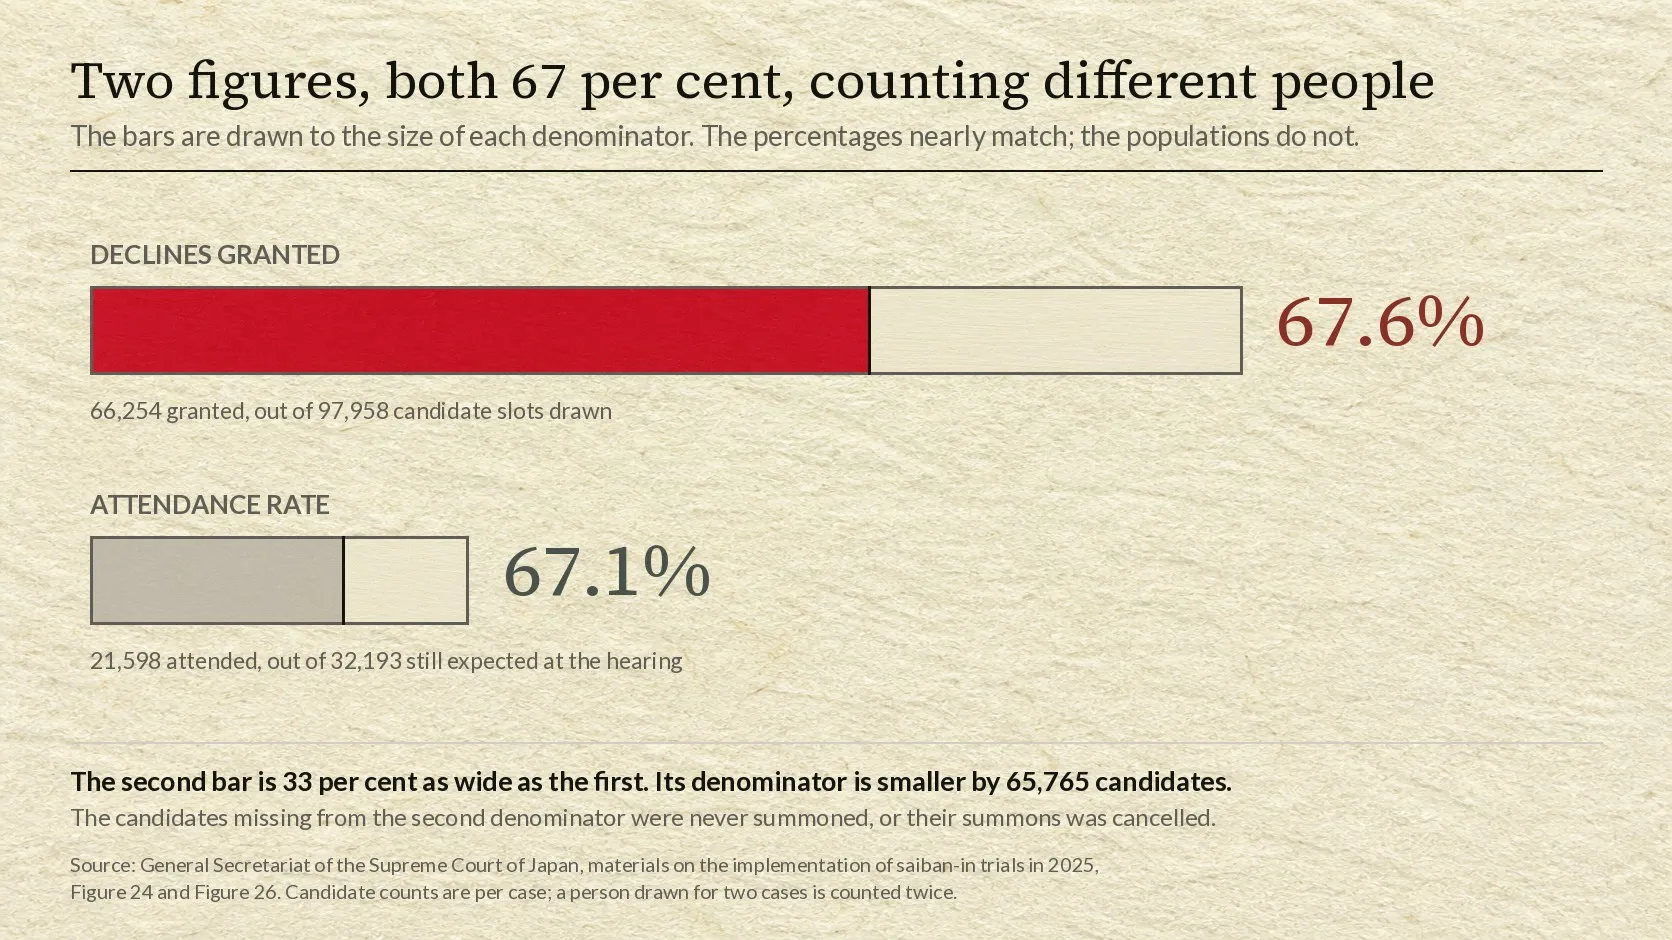
67.1 per cent is not 67.6 per cent, and it is not measuring the same population. The attendance rate is calculated on the candidates who were still expected at the hearing: summonses sent, minus summonses cancelled. That is 32,193 people, of whom 21,598 came.
The two numbers are close enough to be mistaken for each other, and far enough apart to make a sentence false. Once a writer has “67 per cent” in their notes without the label, both readings are available and only one is correct.
Half the declines are granted after the letter is sent
The three stages in the definition are not equal, and their proportions say something about how the system runs.
| When the decline was granted | Candidates | Share of 66,254 |
|---|---|---|
| Before the summons: not summoned at all | 29,614 | 44.7% |
| After the summons was issued: cancelled | 34,136 | 51.5% |
| On the day of the selection hearing | 2,504 | 3.8% |
More than half of all declines granted in 2025 were granted after a summons had already gone out. In total the courts issued 67,535 summonses and cancelled 35,342 of them: 52.3 per cent of the letters sent were withdrawn before the hearing.
Only 3.8 per cent of declines were granted at the hearing itself. By the time the room fills, the sorting is essentially finished. This matters for reading the attendance rate, because the population it measures has already been filtered twice.
The court prints a warning about its own denominator
The most unusual thing in Figure 24 is not a number. It is note 3, in which the Supreme Court explains what its own attendance rate includes:
Note that the “persons asked to attend the selection hearing” also includes saiban-in candidates to whom the summons never arrived and whose attendance therefore cannot realistically be expected.
The court is saying that its denominator contains people who could not have come, because the letter did not reach them. Note 2 adds that the “not summoned” and “cancelled” counts include people excluded for statutory disqualification or prohibited occupation, and people whose candidate notification was returned as undeliverable after a change of address.
This is why the 30,423 not summoned is larger than the 29,614 declines granted at that stage, and why 35,342 cancellations is larger than 34,136. The gap is disqualifications and undelivered post.
A rate that the publishing body annotates as containing people who never received the letter is not a measure of willingness. The court says so in the same table.
The national figure is lower than most courts
The 67.6 per cent is a single national average, and Figure 26 also gives it for each of the 60 district courts and branches that held lay judge trials in 2025. The national number does not describe most of them.
| Declines granted | |
|---|---|
| National | 67.6% |
| Median court | 69.4% |
| Lowest: Nagoya District Court, Okazaki Branch | 60.7% |
| Hakodate District Court | 60.8% |
| Naha District Court | 61.1% |
| Tokyo District Court, main branch | 63.0% |
| Highest: Tottori District Court | 77.8% |
| Nagano District Court | 76.8% |
| Kushiro District Court | 75.7% |
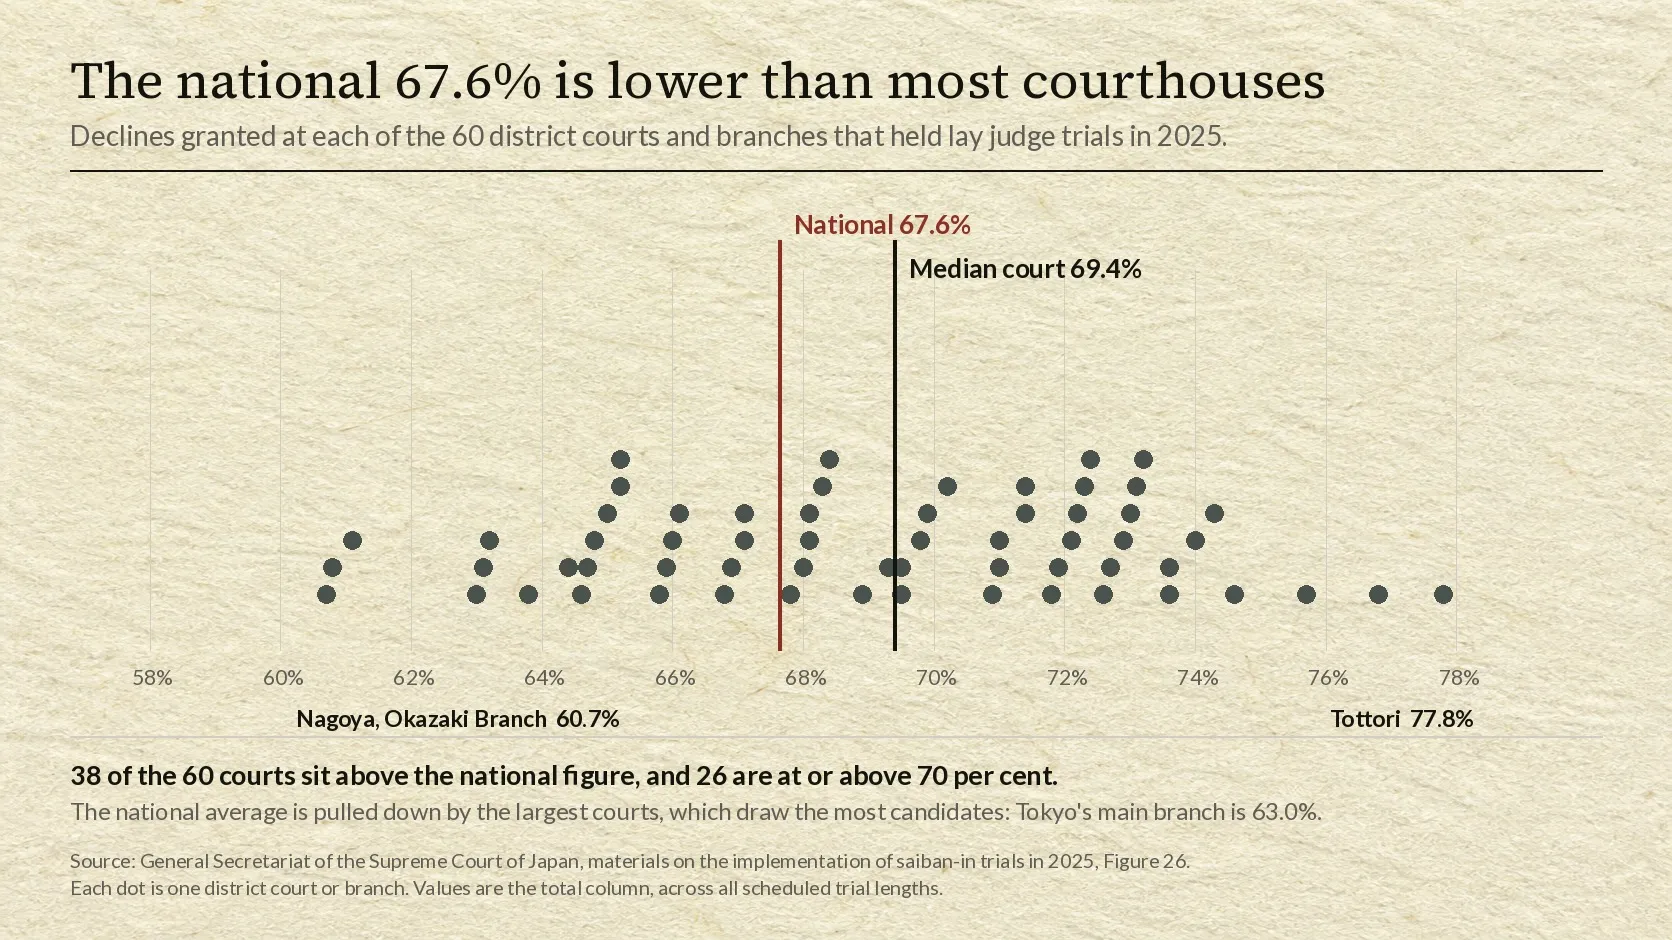
Thirty-eight of the 60 courts are above the national figure, and 26 are at or above 70 per cent. The national average sits below the median because the largest courts, which draw the most candidates, are near the bottom of the range: Tokyo’s main branch is 63.0 per cent, Nagoya 63.2, Sapporo 64.4, Osaka 66.1.
So the direction of the error in English-language writing runs both ways at once. “Almost 70 per cent of Japanese citizens refuse” overstates what the number means. It also understates what happens at most courthouses, where the figure is above 69 per cent, and at Tottori, where more than three quarters of candidates were excused.
The longer the trial, the more declines are granted
Figure 26’s other axis is the number of days the trial was scheduled to run. The national figure broadly rises with length, with one dip:
| Scheduled trial days | Declines granted |
|---|---|
| 3 | 63.9% |
| 4 | 65.4% |
| 5 | 64.9% |
| 6 | 65.7% |
| 7 | 66.7% |
| 8 | 67.9% |
| 9 | 68.4% |
| 10 | 70.5% |
| 11 or more | 72.4% |
The rate climbs 8.5 points from the three-day column to the eleven-day-or-more column, falling back once, at five days. The average trial in 2025 was scheduled for 7.5 days, between the two middle columns.
The longest schedules belong to the gravest charges, which are the only ones the system hears, and which include the cases where a death sentence is available.
The table does not say why the gradient exists. Work is the second largest ground at 27.9 per cent and is the one that would plausibly respond to how many days a citizen is asked to give up, but the report does not cross-tabulate ground against trial length, so that remains an inference and not a finding.
What actually changed since 2009
The first report, covering 2009, is on the same page of the same website. Two figures from it:
| 2009 | 2025 | |
|---|---|---|
| Declines granted | 53.1% | 67.6% |
| Attendance rate | 83.9% | 67.1% |
Both moved, and they are the two figures most often reported as one. In 2009, 5,415 candidates attended selection hearings, and 83.9 per cent of those still expected turned up: roughly five in six. Sixteen years later it is 67.1 per cent.
The attendance rate has fallen 16.8 points. The declines-granted figure has risen 14.5 points. They are separate series, they moved by different amounts, and only one of them is about people who did not come.
What the English-language record says
Nippon.com, reporting the system’s fifteenth anniversary, writes:
The percentage of citizens who can be chosen as lay judges but refuse to serve has risen from 53.1% in 2009
The 53.1 per cent is exactly the Supreme Court’s 2009 figure for declines granted. The number is correctly copied. The label is not. “Refuse to serve” describes something a citizen does; the statistic records something a court decided, on an application, under headings the Act supplied. In the current year, the largest of those headings, 41.5 per cent of the total, covers people who qualify by age, by enrolment or by prior service.
The South China Morning Post, under the headline “Why are Japanese citizens refusing to show up for jury duty?”, puts both readings in one article. Its text says “in 2009, when lay judges were introduced, 53 per cent of people declined to serve”, and that “almost 70 per cent of Japanese citizens called for jury duty refuse to serve”. The 53 per cent is the Supreme Court’s declines-granted figure again, and the article presents the “almost 70 per cent” as the later value of that same series, describing it as having risen from 53 to 65 and then to almost 70. So the numbers in the text are the declines series throughout. The headline is about who turned up. The two are different statistics, and the article’s own figures belong to the first one.
This is the second time the same shape of error has turned up in these files. English-language accounts of how many bodies Japan autopsies have for a decade attached the autopsy rate to the wrong denominator, describing it as a share of unnatural deaths when the police were dividing by the bodies they handled. In both cases the number was copied accurately and the label was not.
This is not a translation problem. The Japanese phrase the court uses is jitai ga mitomerareta saiban-in kōhosha no wariai, the proportion of candidates for whom a decline was granted, and the passive verb is doing the work. The report defines it in its glossary and repeats the definition under the table. It is a labelling problem, sixteen years old, in which a rate of applications granted has been read as a rate of refusals, and then as a rate of absences.
Japanese criminal procedure collects these. The country does have plea bargaining, and almost nothing an English-speaking reader assumes about the phrase applies to it. A statistic can be mislabelled the same way an institution can.
Who the sorting leaves on the bench
The report also asks the people who attended and the people who served how old they are. Figure 20 gives the answers, and it carries its own caveat: the figures come from questionnaires returned by respondents, so they cover 13,933 of the 21,598 who attended and 4,513 of the 4,691 appointed, as real people rather than candidate slots.
| Age | Attended a hearing | Appointed as lay judge |
|---|---|---|
| Under 20 | 114 | 32 |
| 20s | 1,845 | 651 |
| 30s | 2,252 | 733 |
| 40s | 2,982 | 1,014 |
| 50s | 3,467 | 1,162 |
| 60s | 2,690 | 737 |
| 70 or over | 531 | 139 |
| Not stated | 52 | 45 |
The bench thins sharply at exactly the line the statute draws. Respondents in their sixties account for 737 appointments; those seventy and over account for 139, one fifth as many. The same cliff is already present among the people who turned up: 2,690 in their sixties, 531 at seventy or over.
That is what a categorical exemption does. Article 16’s first item is age seventy, and 41.5 per cent of all declines granted rest on items one to seven. The effect is visible two stages later, in who is sitting in the jury box. The report does not publish the age distribution of the candidate list itself, so how much of the gap is the exemption and how much is the composition of the electoral rolls cannot be separated from this source.
One more figure from the same table cuts against the intuition that work removes the employed. Of the 4,513 appointed lay judges who answered, 2,736 described themselves as regular employees, 60.6 per cent. Work is the second largest ground for being excused, at 27.9 per cent of declines, and salaried employees are still the largest group on the bench. The exemption for an important business duty is not a general exemption for having a job.
What is settled, and what is not
Settled: the 67.6 per cent for 2025 is the share of selected candidates whose application to be excused was granted; 41.5 per cent of those grants rest on Article 16’s categorical grounds, of which age seventy and over is the first; the attendance rate is a separate 67.1 per cent; the court annotates that rate as including people the summons never reached; the median court is at 69.4 per cent and the range across 60 courts is 60.7 to 77.8; and in 2009 the same two figures were 53.1 and 83.9. Also settled: 4,691 people sat as lay judges in 2025 across 801 verdicts, and 139 of the 4,513 respondents among them were seventy or over.
Not settled: how much of the movement since 2009 is a change in willingness. The report does not ask candidates why they applied, and the grounds are legal headings rather than motives. A person aged seventy-two who would have served gladly appears in the same 41.5 per cent as a person who wanted out. The largest category is defined by age. If the candidate pool has aged over the same sixteen years, part of the rise would follow from the composition of that pool rather than from anyone’s opinion. The report does not publish the age distribution of the candidate list, so the size of that effect cannot be calculated from this source, and this article does not claim it.
Also not settled: what happens to the 35,342 cancelled summonses. The report gives the total and the grounds, but not how many were cancelled because the case settled, collapsed or was rescheduled before the hearing, which is a court’s decision and not a candidate’s at all.
So: does 67.6 per cent of Japan refuse jury duty? Two thirds of the candidate slots the courts drew last year were released, and the largest block of grounds on the paperwork is the one the Act wrote down in advance, headed by a date of birth. 4,691 people sat as lay judges. The number that gets quoted describes a decision made by a court, on an application, under a heading the law supplied, and it is reported as an act of refusal by the public.
In this article
- Quick answer
- Where the number comes from
- What the whole funnel produces
- The largest block of grounds is a list the Act wrote
- There is a second 67, and it is a different thing
- Half the declines are granted after the letter is sent
- The court prints a warning about its own denominator
- The national figure is lower than most courts
- The longer the trial, the more declines are granted
- What actually changed since 2009
- What the English-language record says
- Who the sorting leaves on the bench
- What is settled, and what is not